
The big political issue facing the market is CA Prop 10, which, if passed in November, repeals the limits on local rent control laws enacted in the Costa-Hawkins Rental Housing Act. This would almost certainly have negative ramifications for owners of multi-unit residential properties in San Francisco and Oakland. The CA Legislative Analyst Office does a good job summarizing the issues: Prop 10 Review. Prop 10 is currently creating something of a shadow on the larger apartment building market, with some buyers waiting for election results – much as happened with SF Prop G did in 2014. (Prop G failed and the market rallied dramatically after Election Day.) However, the market certainly did not grind to a halt in Q3, nor did values plunge.
Historically speaking, it has been difficult for rent control measures to pass on a statewide basis, because homeowners, all of whom are potential landlords, outnumber tenants in California. On this issue, people tend to vote for their financial interests, and homeowners generally vote in higher percentages than tenants. Strong rent-control measures are generally found only in tenant-majority communities. All of which is not to take for granted what will occur on November 6.


This report generally separates out the 2-4 unit and the 5+ unit apartment building markets, since they have different dynamics and values. All the statistics herein are broad generalities covering a wide variety of buildings of a very different location, ages, sizes, quality, condition, tenant profile, income, and income potential. The number of sales in many of the segments is relatively small, which can make the statistics more prone to anomalous fluctuations.
Some charts pertain to multiple counties, and others drill down on statistics specific to San Francisco; some track the last 12 months of sales, and others have a final data point reflecting 2018 YTD sales. All numbers should be considered good-faith, general approximations.
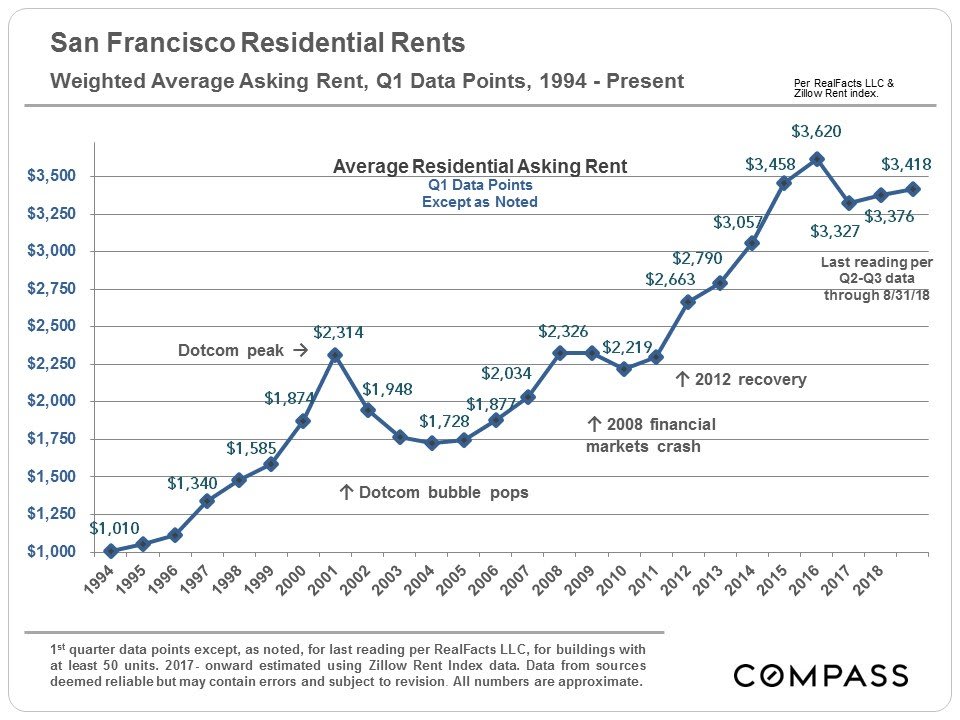
Trends in Residential Rents


This chart below tracks longer-term average asking rent trends, instead of median asking rent appreciation since 2012, as illustrated in the charts above. It provides a bit more historical context.
Sales, Prices & Market Trends


2-4 Unit Buildings


5+ Unit Buildings: Inventory, Sales & Values
The inventory of active listings ticked up in the last 2 quarters.


SF 5+ Unit Buildings: Trends in Gross Rent Multiple,
Cap Rate & Dollar per Unit Value
Many of the standard value parameters have remained remarkably
consistent in San Francisco over recent years.
consistent in San Francisco over recent years.


San Francisco New Construction Pipeline
Almost 70,000 housing units are now in the SF new construction pipeline. Plans are constantly being added, revised, and abandoned, and new housing construction is extremely sensitive to changes in economic conditions.

Q3 2018 Sales of San Francisco 5+ Unit
Apartment Buildings
San Francisco is a unique residential investment market: the buildings are smaller and older than in most places, built in a wide range of architectural styles. The great majority of the market is under rent control, which makes upside rental income potential a big component of valuation, even if it is unknown when that potential might be realized. Within the city the variety of buildings and units is enormous.


In real estate, the devil is always in the details: If you are interested in further insight into the details of any of the above sales, or regarding properties currently on the market, please contact me.
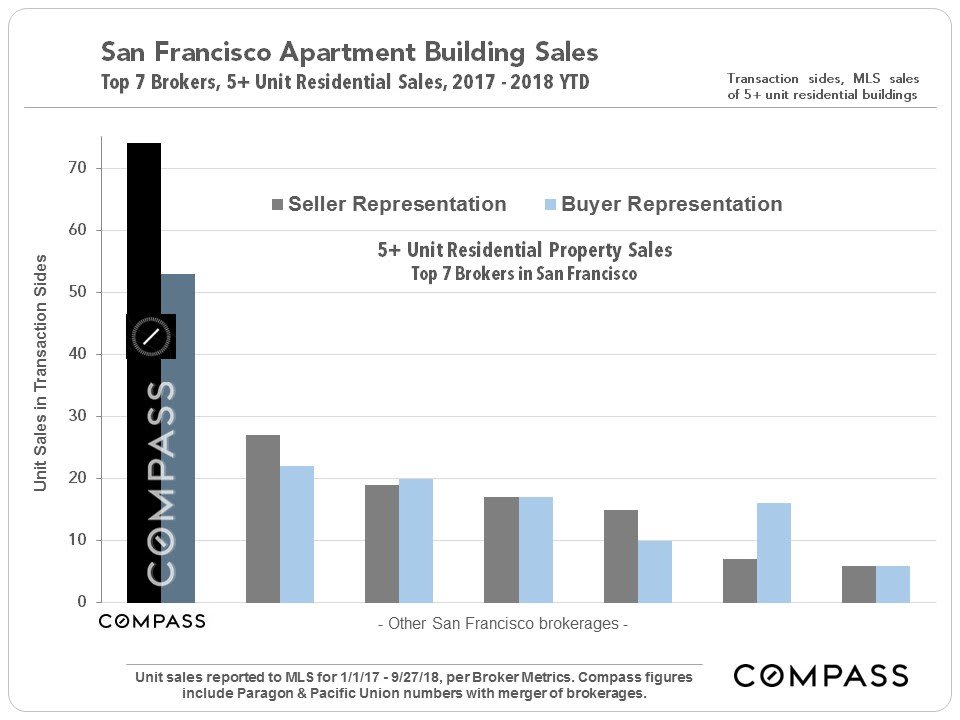
Broker Performance in
Residential Multi-Unit Property Sales
In the summer of 2018, Paragon and Pacific Union merged into Compass to create the largest residential investment property brokerage in San Francisco.

It is impossible to know how median and average value statistics apply to any particular apartment building without a specific, tailored, comparative market analysis. Statistics are generalities: This is especially true for multi-unit properties, with an enormous range of property types, sizes, conditions, circumstances, qualities, financial data, and locations. We are often dependent upon listing agents for income and expense details, which can be of varying accuracy. A percentage of investment property sales are not reported to MLS, which sometimes limits our ability for more comprehensive data analysis.
Compass is a real estate broker licensed by the State of California, DRE 01527235. Equal Housing Opportunity. This report has been prepared solely for information purposes. The information herein is based on or derived from information generally available to the public and/or from sources believed to be reliable. No representation or warranty can be given with respect to the accuracy or completeness of the information. Compass disclaims any and all liability relating to this report, including without limitation any express or implied representations or warranties for statements contained in, and omissions from, the report. Nothing contained herein is intended to be or should be read as any regulatory, legal, tax, accounting or other advice and Compass does not provide such advice. All opinions are subject to change without notice. Compass makes no representation regarding the accuracy of any statements regarding any references to the laws, statutes, or regulations of any state are those of the author(s). Past performance is no guarantee of future results.
© 2018 Compass